-ALC-Statement.jpg)
EN1
Materials Used by Weight or Volume
EN2
Percentage of Materials Used That Are Recycled Input Materials
A conversation on our progress and commitment to sustainability
Supporting the production of crops through crop nutrition
Taking the lead in market, product and industry practices
Strengthening our transparency & commitments
Details on 2010 through 2013 financial and non-financial performance.
An update on goals developed in 2012
Our business used the following raw materials in 2013:
| Materials Mined or Consumed Reported in Million Tonnes |
|
|---|---|
| CY 2013 | |
| Ammonia | 1.34 |
| Limestone | 0.28 |
| Micronutrients | 0.01 |
| Phosphate Rock | 13.90 |
| Potash Ore | 29.75 |
| Sulfur | 3.69 |
| Notes: Ammonia purchases depicted in table above are for production of crop nutrients in Phosphates business unit only. | |
Limestone is used to produce our animal feed products and for water treatment processing. Sulfur, a by-product of crude oil and natural gas de-sulfurization, is used to produce steam, electricity and sulfuric acid, which is used to produce phosphoric acid. We use by-product heat from sulfuric acid production to generate steam that we use in our operations and to generate electricity. Sulfur is also used in the production of our MicroEssentials® product line. Various micronutrients, including boron, zinc, sulfur and cupric oxide, are key ingredients in our MicroEssentials product line. Ammonia is used in our finished products, DAP, MAP and MicroEssentials, and to neutralize the pH of the stack gases at our Esterhazy potash mine.
Sulfur is the most significant recycled raw material in our manufacturing processes. The sulfur used is recovered from crude oil and natural gas processing and then recycled in our plant operations to produce sulfuric acid, which we use to make phosphoric acid, steam and electricity. In 2013, sulfur made up approximately 7.5% by weight of our total raw materials. We recycle the catalyst used in our sulfuric acid production and recover the vanadium for recycling. We also use recycled oil as a flotation aid in our phosphate beneficiation process.
Mosaic’s worldwide total direct energy consumption in 2013 was 87.69 million gigajoules (GJ).
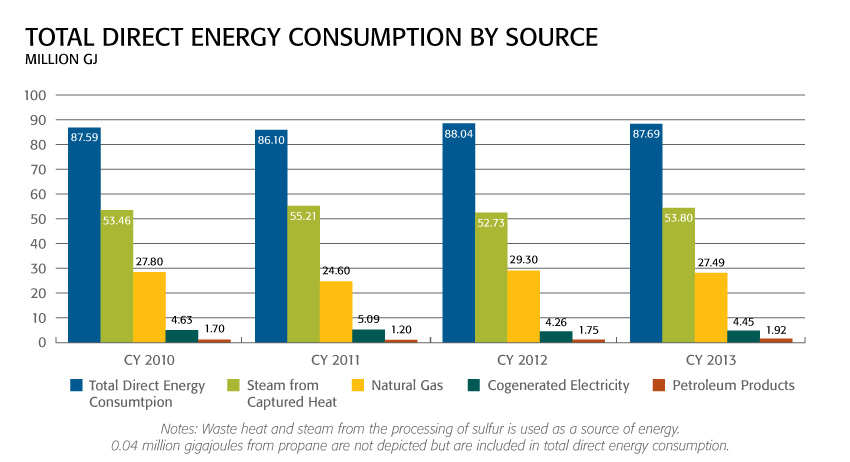
Approximately 98% of Mosaic’s worldwide total direct energy consumption in 2013 was from two sources: waste heat from sulfuric acid production and natural gas. The remaining portion was made up of petroleum products and propane.
Our Phosphate operations require the production and consumption of sulfuric acid to liberate crop nutrients (phosphorous) from raw material inputs. The manufacture of sulfuric acid is an exothermic process, generating tremendous amounts of waste heat. Most of our finished phosphate crop nutrient manufacturing operations have installed bottoming cycle combined heat and power systems to convert this waste heat primarily into steam, used in the phosphate manufacturing facilities and mines.
In 2013, our Phosphate operations used a portion of this energy to produce 5.17 million GJ of electricity, 86% of which was used internally. We consider the waste heat from sulfuric acid production to be a direct primary energy source for our operations.
Natural gas is primarily used in our Phosphate and Potash operations to generate thermal energy for drying. However, a small portion of this fuel is used to produce steam for internal combined heat and power generation.
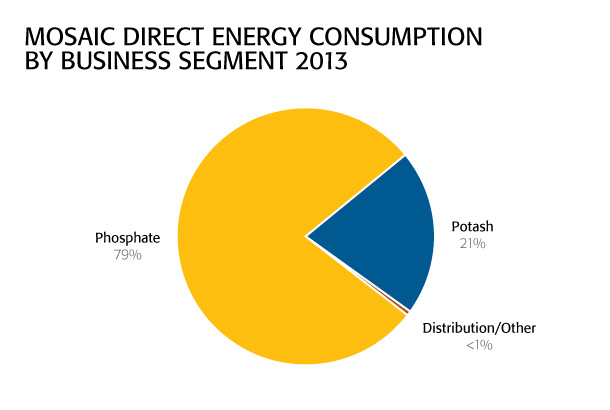
Almost all of Mosaic’s worldwide total direct energy consumption is attributable to its phosphate and potash crop nutrient manufacturing operations. Specifically, approximately 79% is consumed in the production of phosphate crop nutrients while almost 21% is consumed in production of potash. The remaining portion – less than 1% – is consumed within Mosaic’s product distribution network and international production facilities.
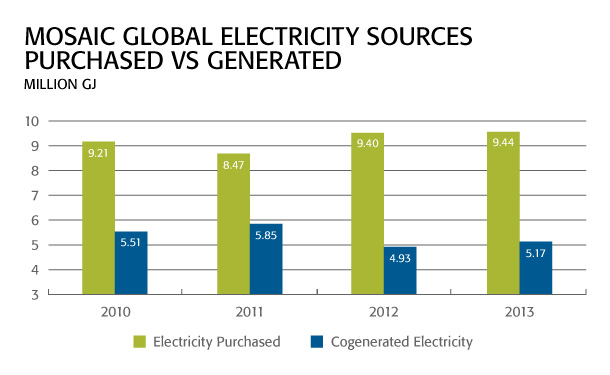
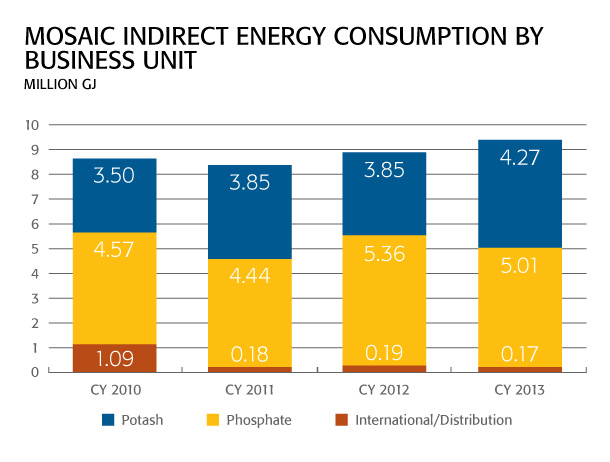
Mosaic consumes indirect energy solely through the purchase of electricity produced by third parties. Mosaic’s worldwide indirect energy consumption was 9.44 million GJ for 2013. The Phosphates business unit reduced the amount of purchased electricity in 2012, due primarily to resuming operation of a turbo generator used to convert waste heat into cogenerated electricity at our Uncle Sam facility. The Potash business unit increased production at some facilities, resulting in an overall increase in purchased electricity.
Approximately 11% of Mosaic’s worldwide indirect energy consumption is from renewable sources, including hydroelectric, bio-mass sources and wind power. Since 2009, almost 100% of the electricity used in our Brazilian operations has come from hydroelectric sources.
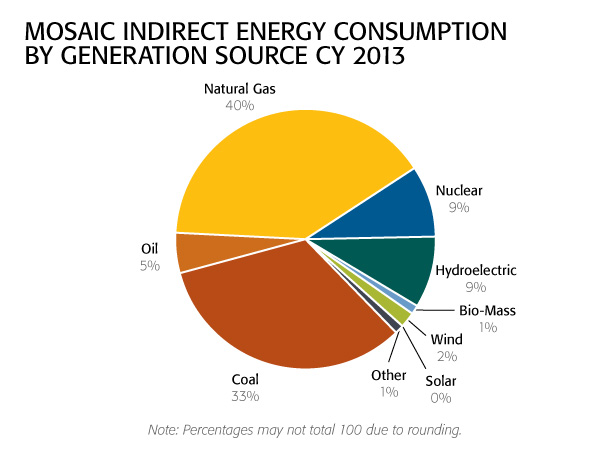
| Mosaic Indirect Energy Consumption by Generation Source CY 2013 | |
|---|---|
| Source | GJ Purchased |
| Natural Gas | 3,741,516 |
| Coal | 3,129,982 |
| Nuclear | 884,439 |
| Hydroelectric | 820,376 |
| Oil | 469,924 |
| Wind | 174,571 |
| Biomass | 94,331 |
| Other Unknown | 76,669 |
| Fossil Fuel Type Unknown | 35,850 |
| Geothermal | 14,828 |
| Solar | 206 |
| Total | 9,442,695 |
| Note: Purchased electricity sources for facilities in the U.S. are based on the U.S. Department of Energy 2012 Emissions & Generation Resource Integrated Database (eGRID) regional. Canada-purchased electricity sources are based on Saskpower 2011 Annual Report. International facilities’ power generation sources are based on the U.S. Energy Information Administration’s national energy profiles. | |
As mentioned in EN3, Mosaic’s Phosphate operations produce a significant amount of electrical power through steam turbine generation from waste heat generated in sulfuric acid production. Phosphate crop nutrient manufacture requires the production and consumption of sulfuric acid to liberate crop nutrients (phosphorous) from raw material inputs. The manufacture of sulfuric acid is an exothermic process, generating excess waste heat. In 2013, Mosaic’s Phosphate operations produced 5.17 million GJ of electricity through this process. Of this 5.17 million GJ, Mosaic consumed approximately 4.45 million GJ internally, offsetting the purchase of electricity from third-party utilities.
Mosaic continuously looks for opportunities to improve the efficiency of, and expand the electricity output of, our cogeneration assets. In 2013, Mosaic completed construction of a new interconnection station to transport cogenerated output for use at our largest phosphate mining facility at Four Corners.
Mosaic emphasizes continuous energy improvements in our manufacturing facilities and support functions. This process is part of a broader strategic business plan designed to help Mosaic meet or exceed production and profitability requirements. This plan includes strategies for lowering purchased energy consumption through more efficient processes and maximizing use of energy generated through the crop nutrient manufacturing process.
To identify and capture potential energy opportunities, we have formed teams of energy representatives at our sites. These teams investigate a number of issues, such as improvements in natural gas use (e.g., efficiencies in boilers, dryers, mine air heating and cogeneration) and improvements in electrical systems (e.g., efficiencies in cogeneration systems and slurry pumping, including extensive use of variable speed drives, air compression, and heating and lighting systems).
In addition, Mosaic regularly conducts energy audits to help identify potential efficiency projects and assess major manufacturing processes such as combustion, general electrical, electric motor systems, compressed air systems and heating. We also have utility engineers assigned to individual facilities to help identify and execute energy efficiency initiatives. Projects are monitored and audited, and the resulting metrics are used to establish key performance indicators. These efforts reduce Mosaic’s overall energy profile, operational costs and use of indirect natural resources.
Mosaic also emphasizes energy efficiency in our office facilities. In 2013, Mosaic’s Florida Corporate Headquarters received ENERGY STAR certification. Mosaic’s leased Regina, Canada, offices were built to LEED standards and included the purchase of interior design elements, furniture and products, as well as other energy efficiencies associated with LEED. Similarly, Mosaic’s Colonsay Mill Dry building was designed and constructed according to LEED standards. The LEED certification process for both buildings is underway.
Due to conservation and efficiency improvement projects that were executed in 2013, Mosaic forecasts annual energy savings of approximately 120,000 GJ. Several examples of energy efficiency efforts by our operations are outlined below.
| Energy Efficiency Efforts by Operations | |||||
|---|---|---|---|---|---|
| GRI Reference | Activity Type | Location | Description of Activity | Estimated Annual Energy Savings (gigajoules) | Estimated Annual CO2e Savings (metric tonnes) |
| EN5 | Energy efficiency-process | Fospar, Brazil | By revamping the exhaust system and increasing the flow of combustion air into the product drying furnace, the Fospar facility reduced its fuel oil consumption by 3.8 kg per metric tonne of finished product. | 61,325.68 | 4,882.86 |
| EN5 | Energy efficiency-process | Qinhuangdao, China | By switching from forklift to truck and trailer to move bags of finished product, Mosaic's Qinhuangdao, China, facility saved .018 liters of fuel per ton of product. The improvement also resulted in annual maintenance cost savings. | 9.96 | 0.10 |
| EN5 | Energy efficiency-process | Bartow | A preheater installed at one of our Bartow facility’s sulfuric acid plants recovers heat from the product acid stream by heating evaporator condensate, which is distributed to the system’s water heaters. By eliminating the use of low pressure steam from existing equipment, the turbo generator can produce more power. | 19,016.21 | 3,194.72 |
| EN5 | Energy efficiency-process | Bartow | Re-rating of a turbine at the Bartow facility resulted in annual energy and CO2e savings. | 28,382.40 | 4,768.24 |
| EN5 | Energy efficiency-process | Four Corners | The Four Corners facility reduced the energy consumption associated with transporting tailings to reclamation sites by using fewer 1500 horsepower pumps when possible, while maintaining overall efficiency. | 5,834.16 | 980.14 |
| EN5 | Energy efficiency-process | Wingate | Replacing a motor on the tailings transportation system resulted in annual energy savings at Mosaic’s Wingate facility. | 4,635.79 | 778.81 |
| EN6 | Energy efficiency-process | Belle Plaine | Through an agreement with an industrial partner in Saskatchewan, Mosaic’s Belle Plaine facility sends water to be used in a cooling process at a nearby plant. The heated water returns to Mosaic’s facility to be used as part of the potash production process. This synergy allows Mosaic to reduce the amount of energy that would have otherwise been spent on heating the water while allowing the industrial partner to avoid cooling costs. | 665,760.00 | 34,488.26 |
| EN6 | Low carbon energy installation | Uncle Sam | In February 2013, Mosaic began full operation of an 11 megawatt hour turbine generator for heat recovery cogeneration at the Uncle Sam sulfuric acid plant in Louisiana, which reduced the amount of electricity the plant purchased in 2013. | 278,074.80 | 39,957.80 |
| EN6 | Process emissions reductions | Four Corners | Mosaic’s Four Corners facility used electric pumps run by cogenerated energy instead of diesel pumps to transport water from a clay settling area, saving approximately 20,000 gallons of diesel fuel and associated GHGs. | 2,606.80 | 197.05 |
| EN6, EN7 | Transportation: fleet | Phosphates operations | In 2013, Mosaic completed the conversion to a natural gas-powered truck fleet for raw materials and finished products in our Central Florida operations. The 50 trucks, operated by transportation partner Dillon Transport, have increased capacity and are powered by clean-burning CNG. Benefits of the conversion include significantly lower emissions of particulates and nitrogen oxides. | - | 2,000.00 |
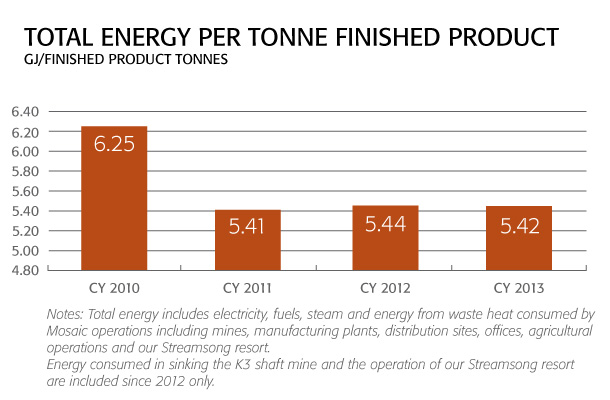
Mosaic’s three-pronged approach of energy management through cogeneration, conservation and greater efficiency aims to lead the industry in reducing the energy we use and maximizing the clean energy we generate. In Mosaic’s Sustainability Goals, published in 2012, we iterate our commitment to evaluating alternative energy sources to satisfy Mosaic’s energy requirements. Since 2008, we have improved our total energy per tonne of finished product by over 10%.
A portion of the electricity required in Mosaic’s operations is satisfied through internal generation of electricity. This process of waste heat recovery, called cogeneration, allows several of our plants and mines to significantly reduce the amount of third-party electricity required from utilities. In October 2005, the Florida state legislature formally recognized that cogenerated electricity is “renewable energy” under Florida statute 366.91. In 2013, Mosaic produced enough electricity in all business units – approximately 6.24 million GJ through cogeneration – to satisfy approximately 44% of our companywide electrical demand. Over 1 million GJ of this cogenerated electricity was sent for use at our mines.
Innovation is one of Mosaic’s strategic priorities. Built on our industry-leading product, process and sustainability solutions, it shapes our long-term strategy as we seek to reduce energy use and GHG emissions while delivering unique value to our stakeholders. Mosaic has a vested interest in the success of our customers, for it is their efforts that provide the food that feeds the world. To this end, Mosaic has developed several products and services that enhance customers' productivity and positively impact their energy efficiency.
For example, in 2013, Mosaic continued full-scale production of Nexfos®, the next generation feed-grade phosphate that is characterized as being a combined source of highly available phosphorous, calcium and sodium. Not only is Nexfos the first innovation in feed-grade phosphate in 40 years, the product is helping Mosaic meet its commitment to sustainability by reducing its environmental footprint. The Nexfos production process has significantly reduced the carbon footprint associated with the production of comparable feed phosphates by requiring approximately 60% less water, 70% less natural gas and 55% less electricity per ton to produce. It also reduces purchasing, storing and handling costs for consumers.
In addition, Mosaic maintains active partnerships with industry-leading research centers, targeting agriculture efficiency and productivity improvements. For more information on our partnerships, please see EN26.
In 2013, energy efficient or renewable energy based initiatives resulted in approximately 950,000 GJ of energy savings. Please refer to the table in EN5 for additional information on our efforts to provide energy efficient or renewable energy based products or services.
Mosaic is concerned with the overall energy impact of our business, including effects outside our operational boundaries. We actively pursue opportunities with the potential to reduce our indirect energy consumption.
Energy efficiency savings are outlined in EN5 and discussed in detail in the Energy Efficiency Efforts by Operations table. Some additional examples of our efforts related to indirect energy consumption reductions include:
| Global Water Withdrawals Total Water Used by Business Unit (All units ,000 m3) |
||||
|---|---|---|---|---|
| Business Unit | CY 2010 | CY 2011 | CY 2012 | CY 2013 |
| International/Distribution | 350.70 | 265.36 | 266.60 | 162.75 |
| Groundwater | 208.58 | 203.04 | 209.42 | 91.46 | Municipal | 48.90 | 62.31 | 57.18 | 71.29 | Surface Water | 93.22 | 0.00 | 0.00 | 0.00 |
| Phosphate - US | 269,184.76 | 239,636.43 | 258,166.63 | 291,020.90 |
| Groundwater | 52,761.75 | 47,632.02 | 60,642.80 | 57,819.68 | Municipal | 63.21 | 31.94 | 60.57 | 62.03 | Surface Water* | 215,646.58 | 191,238.25 | 196,588.17 | 232,202.84 | Wastewater | 713.21 | 734.22 | 875.09 | 936.35 |
| Potash | 19,181.63 | 28,861.51 | 29,840.64 | 27,820.41 |
| Groundwater | 9,728.60 | 10,911.25 | 10,365.82 | 9,365.69 | Surface Water | 9,269.04 | 17,713.26 | 19,265.60 | 18,224.33 | Wastewater | 184.00 | 237.00 | 209.00 | 230.39 |
| Total | 288,717.09 | 268,763.30 | 288,273.86 | 319,004.06 |
| Notes: (*) Includes once-through cooling water. Approximately 49% of Phosphates business unit surface water withdrawals are used for once-through cooling. | ||||
The primary sources of water for operations are surface water, groundwater and rainwater. Secondary sources of water include water supplied by local authorities and partially treated industrial and domestic wastewater, also supplied by local authorities. Surface water withdrawals include once-through cooling water used by facilities in Louisiana.
Mosaic operations capture rainfall, a portion of which is impounded and used in the various production processes, with some discharged through permitted outfalls at Phosphates facilities. Traditionally, Mosaic has considered captured rainfall use as an “alternative water supply,” and it is used in part to estimate recycle/reuse water usage rates at Florida concentrate and minerals operations.
Mosaic’s water withdrawals per tonne of dry product crop nutrient and animal feed production are as follows:
| CY 2013 Water Withdrawals/Production Intensity m3 per tonne of finished product |
|
|---|---|
| Potash | 3.03 |
| Phosphates | 35.40* |
| International | 0.311 |
| Notes: Water intensity = Volume water used in making product (m3) per mass of product manufactured (metric tonnes), per business unit. (*) Includes once-through cooling water. Approximately 49% of Phosphates business unit surface water withdrawals are used for once-through cooling. Production includes all crop nutrients, animal feed ingredients and co-products produced in the calendar year. |
|
Mosaic’s Central Florida fertilizer production facilities operate on more than 90% recycled water. Deep well pumping from the Floridian Aquifer is used as a supplemental water supply on an as-needed basis. Local regulations favor the use of available alternative water supplies, such as reclaimed water from municipalities, before groundwater use. Currently the city of Bowling Green delivers its reclaimed water to Mosaic’s South Fort Meade Mine as a supplemental water supply to further reduce the need for groundwater.
Once water use permits are issued, permit holders must regularly evaluate and report to the Southwest Florida Water Management District on water conservation efforts to minimize groundwater use for processing needs. To demonstrate the substantial results achieved through water conservation efforts over time, in 1991, Mosaic’s predecessors used approximately 1,000 gallons of water to process one ton of phosphate rock; currently the water demand has been reduced by 50% to about 500 gallons of water per ton of phosphate rock. Mosaic’s water use permit also reflects this decrease in demand. In fact, the Integrated Water Use Permit was renewed in 2012 with an annual average permitted quantity of 69 million gallons per day (MGD) versus the previous permit for the same area authorizing water use of 99 MGD, representing a reduction of 30%.
In the Phosphates business unit, with respect to impacts on surface water sources and their associated ecological communities, active mining areas are surrounded by a protective recharge ditch and berm system to maintain the groundwater table elevation adjacent to the mining area and preclude adverse impacts to nearby wetlands and streams. In addition, the Phosphates business unit does not withdraw water from rivers or lakes for water supply supplementation, further protecting ecological resources from undue stress.
The final Areawide Environmental Impact Statement (AEIS), a two-plus-year study released by the U.S. Army Corps of Engineers (ACOE) in April 2013 and supplemented in July 2013, evaluating the cumulative impacts of phosphate rock mining in Central Florida, concludes that the effects from mining on groundwater resources would be “minor” in magnitude and not “significant.” A similar conclusion was reached for surface water resources in the July 2013 AEIS Addendum, which also indicates that surface water and ecological impacts would be “minor” and with mitigation would not be significant.
As another example of our commitment to responsible water use, Mosaic has joined with Duke Energy to eliminate up to 4.6 million gallons per day of groundwater withdrawal in Polk County, Florida. In May 2012, Mosaic and Duke Energy commenced construction on pipelines that link Mosaic’s Green Bay and Hookers Prairie facilities to Duke’s Hines Energy Complex, which allows Mosaic to transfer treated water and storm water to the Hines Complex. The transfer alleviates the need for the Hines Station to pump groundwater.
Responsible use of water is a fundamental component of Mosaic’s global sustainability vision. Our water management programs involve facility-specific and business unit-wide initiatives to reduce our water footprint. Facilities continuously monitor and evaluate water use to ensure it is minimized, and water recycling and reuse are maximized. Recycle and reuse percentage rates for Mosaic’s Potash and Phosphate operations are presented below. Rates and volume are based on total water used by facility, less freshwater withdrawals.
| Recycle and Reuse Volume and Rate | |||
|---|---|---|---|
| Business Unit | Recycle Volume (,000m3) | Recycle Rate | |
| Potash | 155,385 | 87% | |
| Phosphates - Concentrates | 319,024 | 95% | |
| Phosphates - Minerals | 465,679 | 94% | |
| Notes: Carlsbad, NM, South Pierce, FL, and Faustina and Uncle Sam, LA are not included in respective business unit calculations. Belle Plaine and Hersey are solution mines and therefore, water use and methodology for recycle/reuse rate differs from shaft mining operations. Mosaic operations capture rainfall, a portion of which is impounded and used in the various production processes, with some discharged through permitted outfalls at Phosphates facilities. Traditionally, Mosaic has considered captured rainfall use as an alternative water supply, and it is used in part to estimate recycle/reuse water usage rates at Florida concentrate and minerals operations. |
|||
As of December 31, 2013, Mosaic owned or controlled about 329,595 acres of land in Florida related to our Phosphates mining operations. Approximately 100,000 acres of Mosaic’s land holdings in Florida are either in the mine permitting process or have not yet entered the permitting process. For each permit, Mosaic works with a team of professional biologists, hydrologists and other specialists, and in conjunction with as many as 12 local, regional, state and federal regulatory agencies to ensure that all mined areas can be successfully reclaimed and to identify areas of high environmental sensitivity that should be protected.
As of December 31, 2013, Mosaic owns more than 19,000 acres in Florida that are designated as non-impacted floodplain, preservation and granted conservation easements in order to ensure long-term protection of lands or waters of particular sensitivity.
We operate three Canadian Potash facilities, all located in the southern half of the province of Saskatchewan, including our solution mine at Belle Plaine, two interconnected mine shafts at our Esterhazy shaft mine and our shaft mine at Colonsay. Mosaic has mineral rights over approximately 500,000 acres in Saskatchewan for potash mining and surface rights to approximately 30,000 acres. Our U.S. Potash operations include a shaft mine in Carlsbad, New Mexico, and solution mine in Hersey, Michigan. We have mineral rights to approximately 65,000 acres in Carlsbad and 1,800 acres in Hersey for potash mining. Since shaft mining occurs at over 3,000 feet below surface and solution mining requires limited acreage for pipeline and cluster infrastructure, the only surface areas that are disturbed are the actual footprint of the mine shaft and the adjacent above-ground processing facilities.
Mining for phosphate ore in Florida is primarily undertaken using surface mining techniques with large earthmoving equipment such as draglines. This is primarily because the ore body is overlaid by sandy soils with a high water table that is not conducive to underground mining. Due to its unique geology, a dredging technique is used at our Wingate mine.
Discussions regarding ecological resource preservation are held between Mosaic and the regulatory agencies during the permit application process. Preservation areas can include floodplains, as well as high-quality wetland or upland habitats and buffers. Such evaluations take into consideration the type and quality of the habitat. Balancing the supply of phosphate, an important natural resource, against what is generally a temporary disturbance of ecological resources, is an essential consideration through this process.
During the phosphate mining process, parcels are directionally cleared for mining to allow highly mobile animals to move to adjacent undisturbed or preservation areas. In addition, Mosaic obtains permits to relocate specific species in compliance with federal and state laws. After permit approval, state law requires mining parcels to be recontoured and planted with vegetation within two years of the completion of mining activities; all wetlands are replaced acre for acre and type for type, with additional wetlands constructed as needed to meet mitigation requirements. Once a particular parcel is mined and reclaimed, many vertebrates and invertebrates will repopulate the site through migration from wildlife corridors and protected riverine systems. Such migration corridors generally receive permanent protection after mining, with perpetual conservation easements. To ensure biodiversity, Mosaic may also restock the areas with certain species, such as the gopher tortoise, that may have previously resided on the parcel but had been moved from the site prior to mining.
Phosphate mining in Florida, representing our largest phosphate reserve holdings, is heavily regulated by as many as 12 local, regional, state and federal permitting authorities. This robust regulatory oversight is combined with (a) areas that are set aside from mining, (b) reclamation practices that are best in class and (c) monitoring activities such as the Horse Creek Stewardship Program and Peace River Monitoring Programs, which are designed to monitor for and protect against significant impact on biodiversity either within or outside of our property boundaries.
Potash mining operations in Canada and the United States use shaft and solution mining techniques. Because of the limited footprint on surface features, impacts are highly localized to surface infrastructure. Therefore, the impacts to wildlife and habitats are similarly highly localized.
Mosaic reports our Florida mining and reclamation activities to the Florida Department of Environmental Protection (FDEP) Mining and Mitigation Program. As of the date of this publication’s release, 2012’s figures have not been deemed complete by the agency.
| Amount of Land Disturbed and Reclaimed | ||
|---|---|---|
| Phosphate Operations (Florida) 2011 | Acres | Hectares |
| Mined in 2011 | 2,255 | 912.57 |
| Reclaimed Through Vegetation in 2011 | 6,474 | 2,619.94 |
| Released in 2011 | 6,356 | 2,572.18 |
| 1975 through 2010 | ||
| Mined 7/1/1975 through 12/31/2010 | 127,554 | 51,619.27 |
| Total Reclamation (Vegetated + Released) | 87,490 | 35,405.95 |
| Reclaimed Land 1975 through 2010 | ||
| Reclaimed Through Vegetation or Under Industrial-use Criteria | 46,649 | 18,878.18 |
| Reclaimed and Released | 40,841 | 16,527.77 |
| Notes: Acres Released: Acreage on which reclamation has been performed and the area has been released from further reclamation obligation pursuant to Chapter 378, Florida Statutes (FS) and Chapter 62C-16, Florida Administrative Code (FAC). Acres Reclaimed through Vegetation or Under Industrial Use Criteria: Acreage on which contouring and final vegetation has been completed. Some of the acres include lands granted permission to allow reclamation of mandatory lands to an alternate use and have been reclaimed for their intended use. Total Reclamation is the sum of Acres Reclaimed through Vegetation or Under Industrial Use Criteria and Acres Released. All data through December 31, 2010, was compiled from Florida Department of Environmental Protection’s Bureau of Mining and Minerals 2010 Rate of Reclamation Report. |
||
In our Phosphate mining operations, we restore or reclaim every acre of land that is impacted by our activities, with certain areas of high environmental sensitivity set aside for preservation. Mined lands are reclaimed to land uses such as wetlands, uplands, wildlife habitats, parks, neighborhoods and agricultural lands. Much of this land is also suitable for future conventional development such as housing and commercial use.
Mosaic planted 1,389,416 trees in 2013, reclaiming uplands, significant upland habitats and wetlands that require, at a minimum, acre-for-acre and type-for-type per permitting requirements.
Additionally, Mosaic works closely with one of our primary regulators, the Florida Department of Environmental Protection (FDEP) Mining and Mitigation Program, to integrate habitat networks and wildlife corridors into our reclamation planning efforts. The FDEP created, implements and encourages permittees to participate in the development of an Integrated Habitat Network to benefit the water quality and quantity in the area, improve wildlife habitat, and serve as a connection between the mining region’s rivers and significant environmental features outside the mining region.
Mosaic has fostered partnerships with, and funding for, a variety of NGOs and academic institutions to advance our understanding of the habitats we manage through reclamation. Examples of these groups include the Tampa Bay Watch, The Nature Conservancy and Audubon of Florida.
Mosaic’s Potash Business Unit is similarly committed to habitat restoration. For example, Mosaic made a grant to Ducks Unlimited for $2 million that will restore a minimum of 500 acres of wetlands over a 10-year period in Saskatchewan.
Mosaic is committed to minimizing our impacts on the environment through responsible mine planning, permitting, operation and reclamation practices.
The Florida Department of Environmental Protection’s Mining and Mitigation Program oversees mining operations in Florida. The mine permitting process includes performing extensive ecological, wildlife and hydrological surveys, leading to the establishment of boundaries for preservation of areas identified as having important ecological or hydrological value. In addition to the required state, federal and county permits and approvals, FDEP requires the preparation of a Conceptual Reclamation Plan (CRP). The CRP is inclusive of the entire mine site, including the preserved areas outside the operational boundaries. The CRP compares the post-mining, or reclamation plan, to existing site conditions, evaluating site topography, surface water hydrology and impacts to habitats. The CRP also outlines the project schedule. With respect to water quality, the United States Environmental Protection Agency, through its delegation to the FDEP, oversees protection of water quality for storm water, groundwater and surface water originating from mined areas.
Phosphates and Potash operations’ interaction with wildlife in the United States is regulated by state agencies and by the United States Fish and Wildlife Service (USFWS). These state and federal agencies maintain lists of species, and Mosaic develops species-specific habitat management plans to ensure species are properly protected. In addition, Mosaic works closely with regulators to fund and conduct research that promotes the goal of wildlife and habitat conservation.
Mosaic uses a combination of database searches and geographic information system (GIS) mapping in conjunction with field surveys to document the occurrence or potential for occurrence of state and federally listed floral and fauna species within operational areas. Mosaic evaluates potential impacts on plant and animal species based on those protected by applicable state and federal regulations and defines the appropriate protective measures in the habitat management plan. Wildlife surveys are performed prior to the submission of mine permit applications. Once approved, but prior to mining disturbance, additional surveys are performed to ensure the most up-to-date information is available in the event there has been wildlife immigration or changes to nesting/breeding areas. At that time, relocations or nest removal for certain species may occur with proper permits, while for other species protection zones and setbacks are established as required by law. Nest removals, regardless of the species, require all eggs to have hatched and that no flightless young be reliant on the nest.
Significant electrical infrastructure is required to support phosphate mining operations. For Mosaic, as for electrical utilities, electrical structures present a risk of avian injury or mortality. Consequently, Mosaic developed an Avian Electrocution Prevention Plan, submitted to the USFWS and the Florida Fish and Wildlife Conservation Commission. This plan, under which Mosaic currently operates, helps to identify high-risk structures and guide retrofitting lines and facilities that pose the greatest risk of electrocution or collision to large avian species. The plan is based on nesting and feeding sites and demonstrates and furthers Mosaic’s long-standing corporate policy of wildlife protection and wildlife habitat management and restoration.
In our Potash facilities located in Saskatchewan, Canada, our approach to evaluating potential impacts to biodiversity includes biological assessments of proposed expansion sites. These assessments include field surveys to identify rare species of plants, birds, mammals, reptiles and amphibians of special concern that may be impacted. Survey methods follow those recommended by the Saskatchewan Conservation Data Centre. Biological assessments for the proposed Phase IV and V Brine Ponds at the Esterhazy K2 site, tailings expansion area at our Colonsay mine site, K1 Pond F expansion areas and the entire Esterhazy K3 mine site also followed this approach.
The potash mine in Carlsbad, New Mexico, has developed an Avian and Bat Protection Plan to minimize risks to migratory birds and bats that can be attracted to mining and milling areas. Mosaic has also partnered with the USFWS to study risks associated with migratory birds and bats in order to develop future strategies aimed at minimizing avian and bat mortality.
All active sites within the United States and Canada operate in compliance with federal, state/provincial and local regulations related to management of habitat and wildlife. Phosphate mining operations within the United States require extensive assessment of the proposed area of operation. Mosaic performs environmental site assessments, impact studies, hydrologic modeling and prepares conceptual reclamation plans prior to receiving a permit to operate on a parcel of land.
Biodiversity in flora and fauna is an important part of reclamation. Most mitigation plans have biodiversity requirements that must be monitored by qualified ecologists and reported to appropriate regulatory agencies as part of permit conditions or regulations. In fact, compliance with these biodiversity standards is a requirement that must be met before regulatory agencies will deem a site successfully reclaimed.
| International Union for Conservation of Nature (IUCN) Red List of Species Possibly Affected by Operations | ||||
|---|---|---|---|---|
| IUCN Red List Designation | Phosphates Operations (Florida) |
U.S. Potash Operations (New Mexico) |
Canada Potash Operations (Saskatchewan) |
Louisiana Operations |
| Endangered | 0 | 1 – Mexican Long-Nosed Bat | 0 | 2 – Pallid Sturgeon, Alabama Heelsplitter |
| Vulnerable | 3 – Florida Mouse, Gopher Tortoise, Florida Scrub Jay | 1 – Sagebrush Dune Lizard, Lesser Prairie Chicken, Lesser Long-Nosed Bat | 0 | 3 – Alligator Snapping Turtle, Paddlefish, West Indian Manatee |
| Near Threatened | 2 – Gopher Frog, Short Tailed Snake | 1 – Semipalmated Sandpiper | 0 | 2 – Gulf Sturgeon, Southern Creekmussel |
| Least Concern | 19 – Florida Bonneted Bat, Burrowing Owl, Florida Black Bear, Sandhill Crane, Florida Pine Snake, Least Tern, Limpkin, Little Blue Heron, Osprey, SE American Kestrel, Sherman’s Fox Squirrel, Snowy Egret, Tricolored Heron, White Ibis, Wood Stork, Eastern Indigo Snake, Northern Crested Caracara, American Alligator, Bald Eagle | 43 – American Avocet, American White Pelican, American Coot, American Wigeon, Aplomado Falcon, Bar-Tailed Godwit, Black-crowned Night Heron, Black-Necked Stilt, Blue-Winged Teal, Bufflehead, California Gull, Canada Goose, Canvasback, Common Goldeneye, Common Merganser, Double-Crested Cormorant, Eared Grebe, Franklin’s Gull, Gadwall, Glossy Ibis, Great Blue Heron, Greater Yellow Legs, Green Winged Deal, Killdeer, Lesser Sandpiper, Lesser Scaup, Long-Billed Curlew, Long-Billed Dowitcher, Marbled Godwit, Northern Pintail, Northern Shoveler, Red Breasted Merganser, Ring-billed Gull, Ring Neck Duck, Ruddy Duck, Sandhill Crane, Snowy Plover, Surf Scoter, Western Sandpiper, White-Faced Ibis, Willet, Wilson’s Phalarope Least Tern, Snowy Owl | 5 – Eastern Cottontail, Northern Leopard Frog, Turkey Vulture, Bobolink, Red-Headed Woodpecker | 2 – Bald Eagle, Long-tailed Weasel |
| Notes: Avian species listed as affected or possibly affected by New Mexico operations are migratory species with potential migration patterns proximal to the Carlsbad, New Mexico, potash mine. The table includes species and designations of the IUCN and not species and designations of federal or state/provincial agencies in the United States and Canada, by which Mosaic monitors threatened species. |
||||
Mosaic’s Phosphates and Potash operations’ interaction with wildlife in the United States is regulated by state agencies (Florida Fish and Wildlife Conservation Commission and New Mexico Game and Fish) and federally by the USFWS. These state and federal agencies have their own lists of species and management plans that vary by agency. Mosaic works closely with these regulators not only to ensure compliance with management plans, but also to fund and conduct research with the goal of conservation of wildlife and conservation of ecological habitats. Mosaic does not specifically track wildlife species per the IUCN Red List designations, but instead tracks species as designated by regulatory agencies with authority in the regions in which we operate.
For example, the area near our Florida Phosphate operations is home to species listed by federal or state authorities as endangered, threatened or of special concern. Potential impacts have been comprehensively evaluated for each potential mining area. Wildlife agencies have determined that operations would have no impact on those species, or that impacts could be mitigated by minimizing operations in sensitive habitats, creating new habitats for relocation and raising awareness of potential impacts among workers. In our Potash business unit, the rare and endangered species are evaluated as part of our biological assessments for expansion projects.
| Worldwide Greenhouse Gas Emissions (tonnes CO2e) |
||||
|---|---|---|---|---|
| Business Unit | Calendar Year | |||
| Emission Type | 2010 | 2011 | 2012 | 2013 |
| International/Distribution | 299,596 | 34,337 | 100,006 | 69,530 |
| Direct Emissions | 32,698 | 21,047 | 78,263 | 59,039 |
| Indirect Emissions | 266,898 | 13,290 | 21,743 | 10,491 |
| Phosphate | 2,433,097 | 1,910,424 | 2,668,055 | 2,537,613 |
| Direct Emissions | 1,657,887 | 1,177,986 | 1,786,223 | 1,804,960 |
| Indirect Emissions | 775,210 | 732,438 | 881,832 | 732,653 |
| Potash | 1,531,362 | 1,648,629 | 1,741,518 | 1,803,108 |
| Direct Emissions | 889,467 | 943,567 | 1,039,710 | 929,949 |
| Indirect Emissions | 641,895 | 705,062 | 701,808 | 873,159 |
| Grand Total | 4,262,055 | 3,593,390 | 4,509,579 | 4,410,252 |
| Notes: Direct emissions include Mosaic’s consumption of natural gas, diesel, other fuels, process related activities, water treatment and refrigerants. Indirect emissions include electricity purchased from third-party utilities. Mosaic uses guidance from the CDP for calculating and reporting carbon dioxide equivalence (CO2e). |
||||
Mosaic’s reported 2013 direct and indirect CO2e emissions data was reviewed and provided a statement of assurance by Trucost in accordance with AA1000AS standards.
In 2012, Mosaic returned to regular production levels at our Faustina ammonia plant, which resulted in increased emissions of CO2, the primary byproduct of anhydrous ammonia production. Emissions associated with purchased electricity also increased due to downtime of a turbo generator at our Uncle Sam plant. The 2012 emissions also included some areas not previously reported, including greenhouse gas (GHG) emissions from refrigeration units. Production levels between 2012 and 2013 remained fairly constant, resulting in a subtle year-over-year change in total emissions.
Mosaic has established targets for an overall 10% reduction of absolute GHG emissions and a 5% reduction in GHG emissions intensity per tonne of product produced for the Phosphates business unit, from 2005 levels by 2015. These targets exclude emissions associated with ammonia production and our Potash business unit. We have reduced the North American Phosphates business unit’s absolute Scope 1 and Scope 2 (direct and indirect) GHG emissions by more than 21% since 2005. Mosaic’s 2013 GHG emissions per tonne of dry product crop nutrient and animal feed production are as follows:
| 2013 GHG Emissions/Production Intensity Tonnes CO2e per tonne of finished product |
|
|---|---|
| Business Unit | GHG Emission Intensity |
| Potash | 0.20 |
| Phosphates | 0.31 |
| International/Distribution | 0.13 |
| Note: Notes: Emissions intensity = Total CO2e emissions generated in metric tonnes per mass of product manufactured in metric tonnes, per business unit. Production includes all crop nutrients, animal feed ingredients and co-products produced in calendar year, per business unit. |
|
Mosaic has engaged upstream and downstream stakeholders in our supply chain to better quantify the impacts of our business. In 2013, Mosaic collaborated with vendors and contractors to quantify GHG emissions associated with business travel and rail transport of raw materials and finished products.
Scope 3 emissions from ammonia purchases, upstream transportation and business travel are reported below.
| Other Indirect GHG Emissions (tonnes CO2e) |
|||
|---|---|---|---|
| 2011 | 2012 | 2013 | |
| Ammonia Purchases | 2,877,787 | 2,133,499 | 2,120,201 |
| Rail Transport (Florida) | 9,788 | 9,397 | 10,037 |
| Business Travel | 5,557 | 5,335 | 5,140 |
| Total | 2,893,132 | 2,148,231 | 2,135,378 |
| Notes: Ammonia purchases depicted in table above are for production of crop nutrients in Phosphates business unit only. Factor for purchased ammonia revised for 2013 and prior years per IPPC 2013 guidance for ammonia production with modern, natural gas ammonia plants. | |||
We continue to evaluate additional sources of Scope 3 emissions and anticipate expanding the scope of our reporting to include additional sources in the near future.
Mosaic is taking a proactive approach to reductions in emissions, with particular emphasis on improving energy efficiency and waste management. Mosaic’s Sustainability Goals, published in 2012, outline our target to reduce Mosaic’s absolute Greenhouse Gas emissions by 10% and our GHG intensity by 5% in our North American Phosphates business unit from 2005 levels by 2015. (Intensity per tonne of product and GHG targets exclude ammonia production due to pending decision on capacity expansion.) We have reduced the North American Phosphates business unit’s Scope 1 and Scope 2 (direct and indirect) GHG emissions by more than 13% since 2005.
Mosaic has implemented innovative efficiency programs in our Phosphates facilities and Potash facilities to target improving energy efficiencies. With dedicated budgets and staff allocation, the goal of these programs, collectively, is to make our businesses more efficient and effective by growing value, increasing our return, transforming business practices, reinventing our culture and promoting accountability. Focus areas to date are procurement optimization (bidding, consolidation of vendors and materials, and consumption of process chemicals); maintenance workflow or execution efficiency, which translates into reduced use of third-party contractors, overtime and Mosaic personnel; energy and operations effectiveness through the understanding of our organization’s “health” or readiness to change and execute change; implementation of a performance management process (metrics-driven top to bottom, along with a cadence of effective discussions and action over those metrics); and OEE, or asset utilization optimization (downtime and utilization improvements to increase production where needed, or decrease emergency downtime, assets needed, etc.).
Greenhouse gas emission reductions resulting from voluntary initiatives reported in EN5, EN6 and EN7 equal approximately 93,000 tonnes of CO2e.
For more information on Mosaic’s efforts to reduce GHG emissions and address climate change, please see our 2013 Carbon Disclosure Project Response.
Mosaic does not produce CFCs, HCFCs, halon or methyl bromide in any of our operations. Refrigerants used in air conditioning units at our offices and production facilities represent a nominal quantity and only appropriate outside firms or certified internal technicians maintain these units. Air conditioning systems on some vehicles and equipment are maintained by Mosaic personnel. Ozone-depleting substances are phased out as required when units are replaced. In 2012, Mosaic inventoried refrigeration units in over half of its worldwide facilities for potential emissions related to global warming potential and ozone depleting potential (OZP). Mosaic has targeted the remaining facilities, including acquisitions, to be inventoried in 2014. Potential GHGs from refrigerants, expressed in CO2e, are included in EN16.
Mosaic recognizes the importance of careful air emissions management and proactive reduction of these emissions from our operations. We use published emission factors and engineering estimates, as well as analytical stack sampling results, to calculate the following criteria air and other pollutants emissions for Phosphates and Potash operations.
| Criteria Air and Other Pollutants (in ,000 tonnes) |
||||
|---|---|---|---|---|
| 2010 | 2011 | 2012 | 2013 | |
| NOx | 2.70 | 3.54 | 4.56 | 3.06 |
| CO | 0.85 | 0.94 | 1.77 | 4.02 |
| PM | 3.73 | 3.96 | 3.66 | 3.87 |
| SO2 | 22.70 | 16.94 | 13.11 | 13.65 |
| VOC | 1.29 | 1.32 | 2.61 | 0.25 |
| NH3 | 0.77 | 0.63 | 1.10 | 1.40 |
| FL | 0.15 | 0.16 | 0.15 | 0.14 |
| H2S | 0.014 | 0.015 | 0.11 | 0.00 |
| SAM | 0.14 | 0.14 | 0.12 | 0.13 |
| HF | 0.38 | 0.47 | 0.45 | 0.07 |
Mosaic’s significant air emissions per tonne of dry product crop nutrient and animal feed production are as follows:
| Normalized Air Emissions CY 2013 Kilogram emissions per tonne finished product |
|
|---|---|
| NOx | 0.188 |
| CO | 0.247 |
| PM | 0.238 |
| SO2 | 0.839 |
| VOC | 0.016 |
| NH3 | 0.086 |
| FL | 0.009 |
| H2S | 0.000 |
| SAM | 0.008 |
| HF | 0.004 |
| Notes: All business units included Emissions based on stack tests and emission factors |
|
Discharges from Mosaic’s U.S. operations to nearby water bodies are highly regulated through federal National Pollutant Discharge Elimination System (NPDES) permits (developed by the state and approved by the EPA), which require ongoing demonstration of compliance with effluent limitations. These limitations are based on the water quality standards applicable to the receiving water body for that discharge and are set at levels that protect the designated uses of that water body, as defined by state environmental regulatory agencies. As an overarching principle, water that falls within the active, operational footprint at Mosaic’s mining and fertilizer production facilities is actively managed, treated if necessary and discharged only through outfalls, whose locations are permitted through the NPDES program. Discharges are monitored, sampled and analyzed regularly by Mosaic, and reported to these regulatory agencies to demonstrate ongoing compliance with these permit limitations. By maintaining compliance with all NPDES permits, Mosaic ensures that its discharges meet existing regulations.
In 2013, Mosaic’s Canadian Potash facilities helped preserve water quality off-site by maintaining a zero-discharge approach, with the capture of surface water runoff from the sites. In certain circumstances of high precipitation events, off-site discharges of surface water runoff are warranted and are approved in advance by the Ministry of Environment. There were no such instances in 2013.
A significant percentage of the total outfall from Phosphate operations is from rainwater, and discharge rates can vary year to year according to levels of precipitation. In Florida, our operations occur in the following river basins: Alafia River, Little Manatee River, Myakka River and Peace River, with one fertilizer manufacturing facility’s outfalls directing water to Tampa Bay. Mosaic’s Phosphates facilities in Louisiana have permitted outfalls that discharge water to the Mississippi River. The following table summarizes the total surface water discharge from our Phosphate operations in Florida and Louisiana combined.
| Total Water Discharge of Mosaic Phosphate Business Unit | |||||
|---|---|---|---|---|---|
| Units | 2010 | 2011 | 2012 | 2013 | |
| Phosphates Business Unit Annual Outfall Discharges | ,000m3 | 404,149 | 287,978 | 321,318 | 444,035 |
| Phosphates Outfall Discharge Annual Phosphorous Loadings | Tonnes | 2,216 | 1,785 | 2,465 | 2,691 |
| Phosphates Outfall Discharge Annual Nitrogen Loadings | Tonnes | 228 | 123 | 115 | 210 |
| Over 30% of outfall volume is once-through cooling water. | |||||
Wastes generated as part of the mining and processing of potash and phosphate are reported under MM3.
Mosaic’s operations generate a variety of nonhazardous solid wastes, including domestic refuse, construction and demolition debris, waste lubricants and spent sandblast media. Mosaic has placed an emphasis on reducing and/or eliminating waste and our recycling program seeks to identify materials that can be diverted from landfills and recycled or reused. The following table summarizes materials recycled or reused in 2013.
| 2013 Recycled Wastes (Tonnes) |
|||
|---|---|---|---|
| Phosphates | Potash | International/ Distribution | |
| Aerosol Cans | 0.28 | 0.00 | 0.00 |
| Antifreeze | 0.85 | 1.99 | 0.00 |
| Compostable Waste | 2.36 | 0.00 | 0.00 |
| Construction and Demolition Debris | 0.00 | 0.00 | 671.97 |
| E-waste and Appliances | 8.37 | 5.35 | 0.00 |
| Glass Waste | 0.00 | 0.00 | 0.91 |
| Hazardous Waste | 1.58 | 0.00 | 0.00 |
| Metals | 5182.69 | 1886.97 | 386.87 |
| Miscellaneous and Special Wastes | 0.00 | 0.00 | 9.55 |
| Oil and Oil Contaminated Items | 163.26 | 83.22 | 7.47 |
| Paper and Cardboard | 63.92 | 0.44 | 15.17 |
| Plastics | 0.00 | 11.60 | 148.70 |
| Rubber | 0.00 | 0.00 | 22.40 |
| Single Stream Recycling | 23.23 | 0.00 | 0.00 |
| Universal Wastes | 11.18 | 15.56 | 1.35 |
| Total Tonnes | 5457.72 | 2005.13 | 1264.39 |
Mosaic’s waste management program provides assurance that all Mosaic locations have a process in place to minimize waste generation and that waste management practices do not adversely affect the environment or health and safety of employees and the public. Mosaic is in the process of developing an updated, comprehensive waste management strategy that complies with Resource Conservation and Recovery Act (RCRA) legal requirements and conforms to the International Standards Organization (ISO) 14001 Standard. Below are examples of hazardous and nonhazardous wastes generated by disposal methods at Phosphates, Potash and international facilities. We anticipate expanding the scope of our reporting for this indicator to include data for all facilities in the near future.
| Waste Generated by Disposal Method 2013 (tonnes) |
|||
|---|---|---|---|
| Hazardous | Nonhazardous | Grand Total | |
| FishHawk – Office | |||
| Incineration | 0 | 113.35 | 113.35 |
| Recycle | 0.80 | 45.90 | 46.70 |
| Faustina – Phosphate Production | |||
| Incineration | 0.82 | 0 | 0.82 |
| Landfill | 0 | 902.70 | 902.70 |
| Recycle | 1.57 | 315.38 | 316.96 |
| Uncle Sam – Phosphate Production | |||
| Incineration | 2.39 | 0 | 2.39 |
| Landfill | 56.66 | 369.35 | 426.01 |
| Recycle | 0.16 | 335.35 | 335.51 |
| Hersey – Potash Production | |||
| Incineration | 0.14 | 0 | 0.14 |
| Landfill | 0 | 162.15 | 162.15 |
| Recycle | 0 | 9.31 | 9.31 |
| Brazil* | |||
| Co-Processing | 16.78 | 0.00 | 16.78 |
| Landfill | 49.09 | 1599.34 | 1648.43 |
| Recycle | 18.36 | 1246.02 | 1264.39 |
| Treatment/Other | 59.32 | 0.00 | 59.32 |
| Notes: Weights may have been estimated or inadvertently excluded from this list; therefore, the totals are approximations only. (*) Brazil includes Alto Araguaia (warehouse and blender), Campo Grande (warehouse and blender), Candeias (warehouse and blender), Fospar (port), Paranagua (warehouse, blender and production), Rio Verde (warehouse and blender), Sorriso (warehouse and blender) and Uberaba (warehouse and blender) facilities. |
|||
| Mining and Mineral Processing Waste Generated and Disposal Method (in tonnes) |
|||||
|---|---|---|---|---|---|
| Material | 2010 | 2011 | 2012 | 2013 | Disposal Method |
| Phosphate | |||||
| Overburden | 133,634,000 | 163,931,613 | 162,012,906 | 146,522,396 | Used for Reclamation |
| Tailings | 38,655,000 | 30,885,900 | 37,459,212 | 34,442,381 | Used for Reclamation |
| Clay | 11,949,000 | 12,798,551 | 14,315,162 | 15,786,278 | Dried in Surface Impoundment |
| Phosphogypsum | 19,381,000 | 20,134,000 | 21,543,380 | 20,602,936 | Managed in Permitted Phosphogypsum Stack Systems |
| Potash | |||||
| Tailings (Salt) | 10,122,250 | 12,004,876 | 12,868,386 | 12,166,694 | Storage or Recycled for Commercial Use |
| Brine | 4,651,714 | 5,722,629 | 4,775,705 | 4,408,041 | Deep Well Injection or Evaporation |
| Notes: Overburden is stored in piles until used for reclamation. Clay is pumped wet to surface impoundments. The drying process for clay takes many years. | |||||
Mosaic uses best industry practices to manage overburden, tailings and byproducts associated with our mining and production. In addition, Mosaic complies with federal, state and local regulations related to these materials.
Mining and processing of potash and phosphate generate residual materials that must be managed both during the operation of a facility and upon a facility’s closure. Potash tailings, consisting primarily of salt and clay, are stored in tailings management areas. Portions of excess salt generated from potash mining is processed and then used for commercial purposes, including road salt, water softener salt, and use in food grade products and industrial uses. Phosphate clay residuals from mining are deposited in clay settling ponds. Certain solid wastes generated by our phosphate operations may be subject to regulation under RCRA and related state laws. The EPA rules exempt “extraction” and “beneficiation” wastes, as well as 20 specified “mineral processing” wastes, from the hazardous waste management requirements of the Resource Conservation and Recovery Act (RCRA). Accordingly, certain residual materials which our phosphate operations generate, like phosphogypsum, as well as process wastewater from phosphoric acid production, are exempt from RCRA regulation.
| Environmental Releases Number of Significant Reportable Releases |
||||
|---|---|---|---|---|
| Mosaic Business Unit | FY 2011 | FY 2012 | FY 2013 | CY 2013 |
| Potash | 10 | 8 | 12 | 10 |
| Phosphates | 4 | 2 | 3 | 4 |
| Distribution | 0 | 0 | 0 | 0 |
| International | 0 | 0 | 0 | 0 |
| Total Significant Releases | 14 | 10 | 15 | 14 |
| Notes: Table includes environmental releases equal to or greater than 2,000 gallons. They were not significant enough to report in our financial statements. Such releases identified for Potash facilities involved brine, dedusting agent, calcium chloride and finished product; and for Phosphates facilities involved storm water, sulfuric acid, waste clay and process water. |
||||
Mosaic facilities generate hazardous waste during production and maintenance operations. In the United States, Mosaic’s Phosphates and Potash facilities are typically either categorized as Small Quantity or Conditionally Exempt Small Quantity Generators (which generate less than 2,200 pounds of hazardous waste per month). The four concentrate facilities in the Phosphates business unit are designated as Large Quantity Generators (which generate more than 2,200 pounds of hazardous waste per month). Canadian facilities comply with all national regulations regarding these materials.
The types of hazardous waste generated at Mosaic’s U.S. facilities typically include spent cleaning solvents, paint-related wastes and some spent laboratory chemicals. At concentrate facilities, wastes generated during production and maintenance operations include waste that is characteristically hazardous for corrosivity and/or toxicity (e.g., low pH and/or metals content). Each location has an appropriate hazardous waste management system to ensure that the waste is properly and safely disposed. No hazardous wastes are shipped internationally for disposal.
The discharge of water and runoff from Mosaic’s mining and fertilizer manufacturing is a highly regulated activity that has stringent reporting and compliance requirements. The release of water via storm water or discharge must comply with these requirements. The standards enforced by the regulatory authorities are designed to protect water bodies and associated habitats from degradation and secondary environmental impacts. None of the points of discharge releases water directly into a designated protected area.
The four riverine basins in which Mosaic operates in Florida include the Peace, Alafia, Little Manatee and the Myakka Rivers. These riverine systems vary in size, as indicated below.
| Florida Riverine Basins Where Mosaic Operates | ||
|---|---|---|
| Water body/basin | Basin size (hectares) | River length (km) |
| Peace River | 608,000 | 169 |
| Alafia River | 109,000 | 38 |
| Little Manatee River | 58,000 | 58 |
| Myakka River | 155,000 | 106 |
Some key examples at our major facilities:
Mosaic has a dedicated agronomy team that conducts field trials to evaluate the performance of our products and develop recommendations to mitigate any potential environmental impact. In 2013, we conducted 435 small-plot trials in Argentina, Brazil, Chile, China, Canada, India, Northern Latin America (Mexico to Peru) and the United States. These trials were conducted by highly regarded private researchers and universities that follow rigorous scientific standards. In addition, more than 65 demonstration plots were conducted in the same countries via collaborations with customers and growers. In total, nearly 500 plots of research were established in 2013.
Mosaic continues its collaboration with a highly regarded crop sciences professor and researcher at the University of Illinois to develop advanced agronomic systems aimed at sustainably increasing corn productivity by combining fertilizer best management practices with other agronomic technologies. This research evaluates nutrient requirements of modern corn hybrids and soybean varieties under different field conditions. A complete understanding of field conditions is a precondition of a balanced crop nutrition program.
Mosaic will continue to support a new educational initiative to help the industry understand fertilizer best management practices as a way of reducing environmental impact.
CropNutrition.com is a resource for retailers, growers and media members seeking to better understand soil science, grow crops that are stronger, and increase productivity and yield in a sustainable manner. By simplifying highly technical and agronomic information, CropNutrition.com is an approachable and digestible digital hub of soil fertility and balanced crop nutrition information.
CropNutrition.com provides a wealth of information in various ways, including:
The CropNutrition initiative is an integrated effort to inform growers and retailers. Through various vehicles, such as print, radio and digital advertisements, as well as social media channels, Mosaic will provide a consistent flow of information around the topics and trends that contribute up to 60% of farmers’ yields.
CropNutrition will give unprecedented access to information and expertise from within the walls of a leading agriculture company and its industry-leading partners. Retailers and growers will benefit from Mosaic sharing information that will allow them to think progressively about crop fertility.
The Nutrient Use Geographic Information System (NuGIS) is a Web-based application developed by IPNI that integrates multiple tabular and spatial datasets to create county-level estimates of nutrients applied in fertilizer and livestock manure, nutrients removed by harvested agricultural crops, and the resulting balance. Mosaic’s membership in the IPNI helps fund this North American database. We have leveraged this information by providing reports specifically for our customers to help them assess nutrient use efficiency and balance.
4R Nutrient Stewardship (4Rs) is about doing everything “right” in regard to fertilizer application and effectively reducing agriculture’s potential for negative externalities. The 4Rs is an innovative and science-based approach that when applied offers enhanced environmental protection, increased production, increased farmer profitability and improved sustainability. The concept is to use the Right fertilizer source, at the Right rate, at the Right time, in the Right place. For fertilizer use to be sustainable, it must support cropping systems that provide economic, social and environmental benefits. Because the 4Rs is critical for sustainability, Mosaic’s goal is to partner with the fertilizer industry to enhance understanding, adoption and promotion of 4R Nutrient Stewardship among stakeholders.
To help address this challenge, TFI has been working collaboratively with the IFA, the IPNI and the CFI to advance the 4R Nutrient Stewardship initiative. Two goals of the initiative include establishing 4Rs as a recognizable strategy for economic, social and environmental sustainability, and expanding the adoption of 4R Nutrient Stewardship globally.
Mosaic established and continues to fund the Mosaic Fertilizer Technology and Research Centre initiative at the University of Adelaide, Australia. The centre focuses on soil chemistry and fertilizer technology, and uses the latest technology to develop innovative fertilizer formulations to improve nutrient use efficiency.
Mosaic also has a long-term partnership with a globally recognized plant nutrition expert at Sabanci University in Turkey, whose research focus is balanced crop nutrition and nutrient interactions conducted through greenhouse experiments.
The Mosaic Company partners with The Nature Conservancy as it conducts a three-year conservation pilot in three watersheds in the Upper Mississippi River basin, including the Root River in southeastern Minnesota, the Boone River in northern Iowa and the Mackinaw River in central Illinois. The Conservancy works with local partners, including farmers, in those watersheds to implement and study conservation techniques that best lower nutrient and sediment concentrations by reducing runoff from agricultural landscapes. Through this project, the Conservancy seeks to determine which tools work best in a larger, sub-watershed system, and will then communicate findings to crop producers to guide their farm stewardship decisions.
Mosaic products, predominantly fertilizer and animal feed ingredients, are used in various stages of agricultural operations with multiple steps and biological processes. To the extent possible, bulk transport is used to minimize the need for extensive packaging throughout the supply chain. Agricultural operation processes are not within Mosaic’s purview to control; however, the nutrient elements of our products often are recycled into these or other agricultural systems. Examples of these systems include:
To further encourage stewardship of our products, Mosaic has formed a product stewardship team from various disciplines and is pursuing opportunities to cooperate with supply chain and logistical partners to identify and implement stewardship enhancements on a global basis.
A reclaimed product example is our use of sulfur, which is a co-product of the petroleum industry and is reclaimed from the crude oil desulfurization process. Our use of this product prevents an excess of sulfur that otherwise could be disposed of in landfills.
Finally, Mosaic supports and helps promote TFI’s Bulk Blend Workshops and Manual, which eliminates the need for packaging of major raw materials or the final product. This process completely eliminates the need for bags, as the product is transferred from dealer to farmer. Because of the sizing and blending capabilities of our bulk materials, we encourage the use of the bulk blending and delivery system in farming operations.
In Form 10-K and Form 10-Qs, Mosaic reports any environmental fine or sanction that it has identified as potentially material to investors, or if not potentially material, as potentially meeting or exceeding a significance threshold of $100,000. In 2013, Mosaic paid a penalty of $245,000 in connection with a settlement of alleged Clean Air Act violations at our Riverview, New Wales, Bartow, South Pierce and Green Bay facilities.
In 2013, Mosaic moved approximately 58 million short tons of raw materials, work-in-progress and finished products. To compare fuel efficiency, the industry standard is to measure ton-miles per gallon (ton/miles/gallon).
The following chart compares the efficiency of the various modes of transportation that Mosaic uses to move our raw materials, work-in-progress and finished goods.
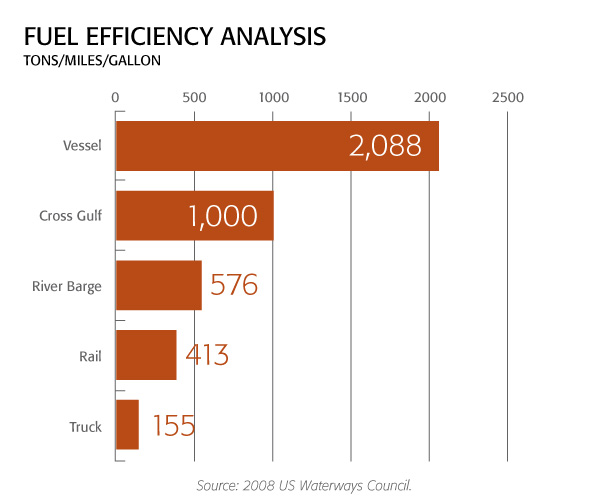
The most fuel efficient transport is by Panamax vessels, which carry approximately 66,000 tons of cargo great distances. In North America, cross-Gulf (Gulf of Mexico) barges are quite efficient. Conversely, trucks can carry approximately 25 tons and yield approximately 155 tons/miles/gallon.
For 2013, our spending on North American transport of materials and products was divided across modes as follows.
The following table summarizes the amount of material transported and number of North American shipments.
| Transport Mode and Weight CY 2013 | ||
|---|---|---|
| Mode | Tons | % by Weight |
| Vessel and XGULF | 13,403,602 | 23% |
| River Barge | 6,898,620 | 12% |
| Rail (Cars) | 25,672,589 | 44% |
| Truck | 11,140,013 | 19% |
| Pipeline | 1,236,899 | 2% |
| Total | 58,351,723 | 100% |
| Notes: This table includes shipments of raw materials and finished product from origin to final destination that originated or ended in North America. | ||
Energy Use and Emissions – Because diesel or a heating oil derivative fuels most of the transportation, the lowest-cost option for the customer is often the option that uses the least fuel and has the lowest potential environmental impact. The vast majority of our truck shipments occur within Florida and are associated with time-sensitive intra-company shipments of sulfur, sulfuric acid and phosphate rock. In addition, the distance traveled in most cases is less than 50 miles, making trucks a generally less expensive and more reliable solution.
Environmental impacts of transporting our materials are primarily related to GHG emissions. When distance traveled is less than 50 miles, trucking is generally the most reliable and cost-effective mode of transport.
During the 2013 reporting period, Mosaic and its transportation partners used various fuel and GHG emission-saving initiatives, including:
Waste – Mosaic has funded and promoted the TFI Bulk Blend Workshops and Manual. Transporting and distributing our crop nutrient products in bulk greatly reduces the amount of packaging required to deliver our products to consumers. Most of our crop nutrient products are transported from production facilities to consumers in bulk quantities. Therefore, environmental impacts associated with packaging are eliminated. In some areas where small-scale farmers purchase our products, bulk distribution is not possible.
Mosaic has expended, and anticipates that we will continue to expend substantial financial and managerial resources to comply with EHS standards, and continue to improve our environmental stewardship.
In the seven months ended December 31, 2013 and in fiscal 2013, we spent approximately $130 and $230 million, respectively, for environmental capital expenditures, land reclamation activities, gypstack closure and water treatment activities.